梶研 [mocopi と action slam2]
2024年1月23日
mocopi と action slam2
出席率
- 3年セミナー:??%
スケジュール
短期的な予定
- mocopi と action slam2
- シーンとランドマークを決める(~2月上旬)
- ?
- 論文書く
- 発表
長期的な予定
- ~?月 シーン検知?をする
- ~?月 論文を書く
- ~?月 論文発表したい
進捗
センシングした
1. mocopiセンシング 本棚&商店&冷蔵庫&椅子 @梶研
2. mocopiセンシング 商店漁り&お湯汲み&流す @梶研
3. mocopiセンシング 冷蔵庫&蛇口捻り@梶研
4. mocopiセンシング ゴミ捨て @梶研(4号館別館)
5. mocopiセンシング 梶研戸締り @梶研
6. mocopiセンシング 車に乗る @第2駐車場
ラベリングをする
一旦ラベリングを楽にする関数を作った
関数のソースコード
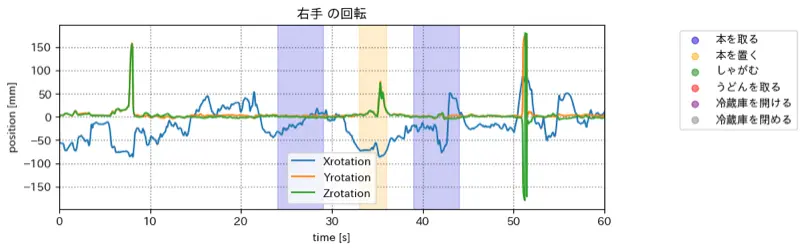
1def plot_joint(bvhp, joint, xlim=(0, 0), ylim=(0, 0), figsize=(12, 3), labels=None, is_position=False):
2    df = bvhp.get_joint_motion_df(joint, mode='relative')
3
4    fig = plt.figure(figsize=figsize)
5    gs = GridSpec(1, 2, width_ratios=[11, 1], wspace=0.5)
6    ax1 = fig.add_subplot(gs[0])
7    ax2 = fig.add_subplot(gs[1])
8
9    joint_name = to_joint_name(joint)
10    ax1.set_title(f'{joint_name} の位置' if is_position else f'{joint_name} の回転')
11    ax1.set_xlabel('time [s]')
12    ax1.set_ylabel('rotation [deg]' if is_position else 'position [mm]')
13    ax1.grid(color='k', linestyle='dotted', linewidth=1, alpha=0.5)
14
15    if xlim[0] < xlim[1]:
16        ax1.set_xlim(xlim[0], xlim[1])
17
18    if ylim[0] < ylim[1]:
19        ax1.set_ylim(ylim[0], ylim[1])
20
21    r_heads = ['Xrotation', 'Yrotation', 'Zrotation']
22    p_heads = ['Xposition', 'Yposition', 'Zposition']
23    heads = p_heads if is_position else r_heads
24    for head in heads:
25        ax1.plot(df['time'], df[head], label=head)
26
27    colors = ['mediumblue', 'orange', 'green', 'red', 'purple', 'gray', 'olive', 'cyan']
28    if labels:
29        for i, l in enumerate(labels):
30            color = colors[i % len(colors)]
31            ax2.scatter([], [], color=color, label=l)
32
33            for s, e in labels[l]:
34                ax1.axvspan(s, e, color=color, alpha=0.2)
35
36
37    ax1.legend()
38    legend = ax2.legend()
39    ax2.axis('off')
40    for handle in legend.legend_handles:
41        handle.set_alpha(0.5)
42    plt.show()
43
1bvhp = BVHparser('./logs/1.bvh')
2
3labels1 = {
4    '本を取る': [
5        [20, 25],
6        [35, 40],
7    ],
8    '本を置く': [
9        [29, 32],
10    ],
11...
12}
13
14for j in bvhp.get_joints():
15    if j[0] == '_':
16        continue
17
18    plot_joint(bvhp, j, (0, 150), (0, 0), labels=labels1)
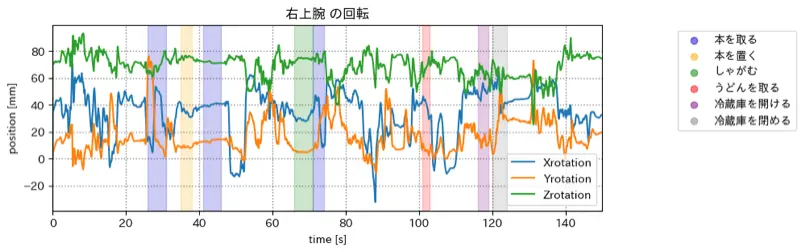
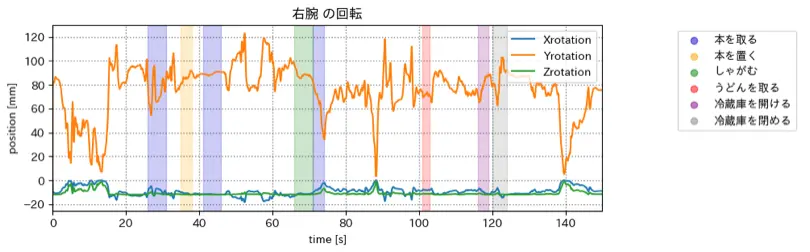
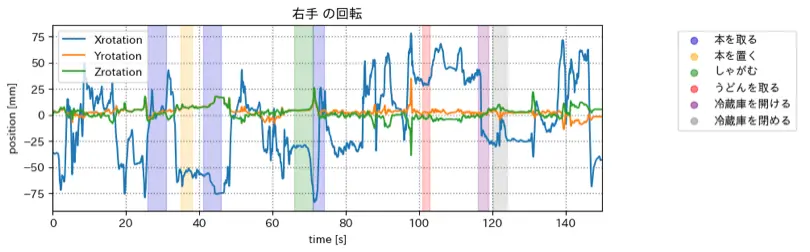
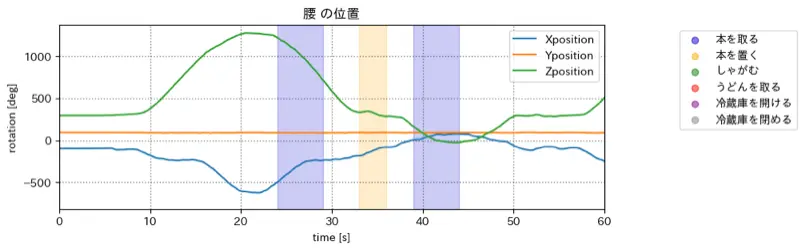
グラフたち
項目が多く、ランドマークの探し方がわからない
全ての項目を使うのは不可能?
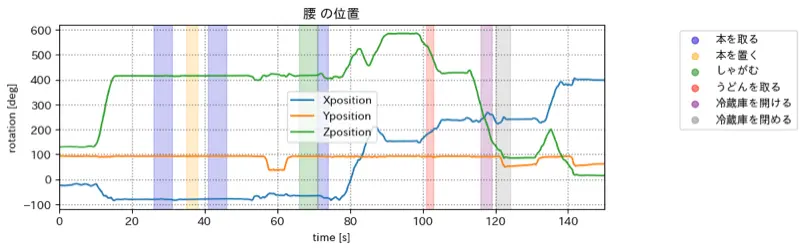
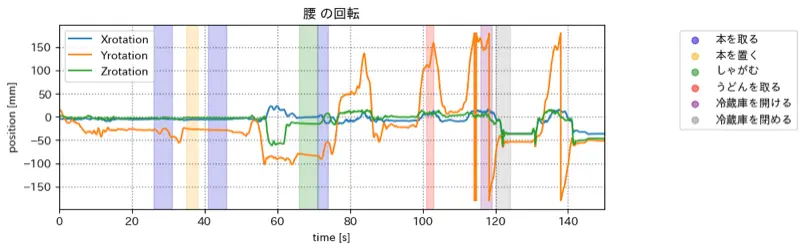
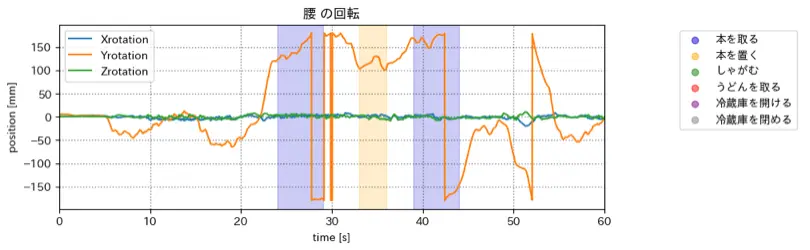
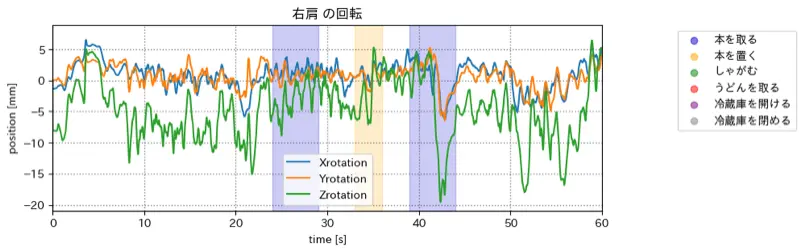
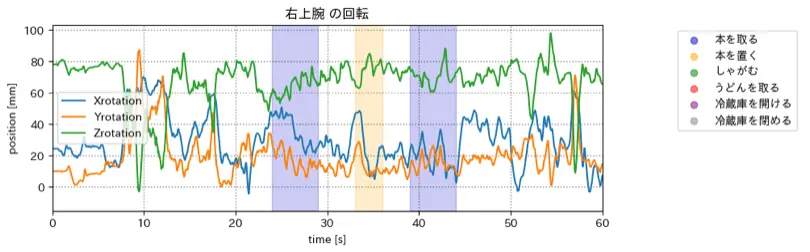
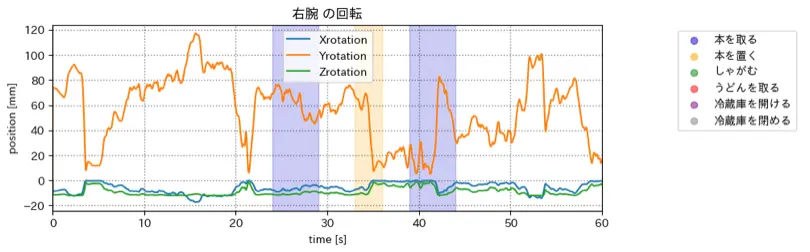
本棚&商店&冷蔵庫&椅子 のグラフ(一部の関節のみ)
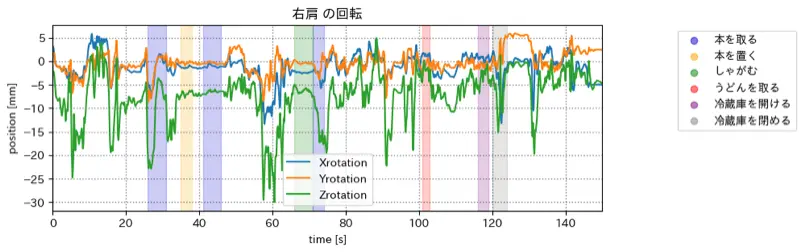
冷蔵庫開け閉め のグラフ(一部の関節のみ)
余談
マップから城を探せるwebアプリを作った(webプロ課題)
主に使ったライブラリ(フレームワーク)
- フロント
- Next.js
- LeafLet
- バック
- Hono
- Cloudflare D1
- スクレイピング
- BeautifulSoup
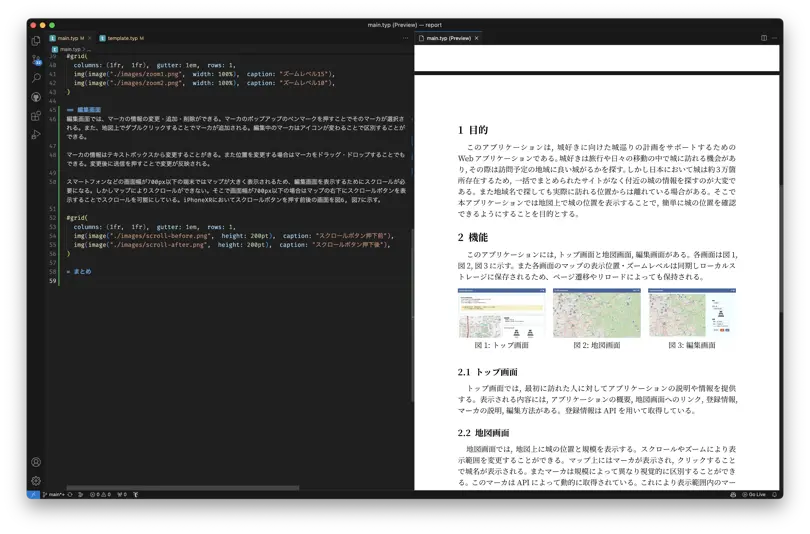
Typst を使ってみた(webプロ課題)
Typst: Tex よりも書きやすく軽く環境構築しやすい組版処理システム
マークダウン x CSS みたいな感覚でかけて幸せ